FeederForge
The Challenge
Due to the energy transition, DSOs are confronted with the rapid growth of solar panels, EV chargers, heat pumps, and home batteries. Grid planners need to know where these are to maintain an accurate view on the available grid capacity and to plan reinforcements. However, manual registration procedures are costly and prone to errors. Also, insights are required on the local behavioral patterns and the impact of these new devices on the synchronous asset peaks, so investment plans can be based on accurate data.
FeederForge is our solution.
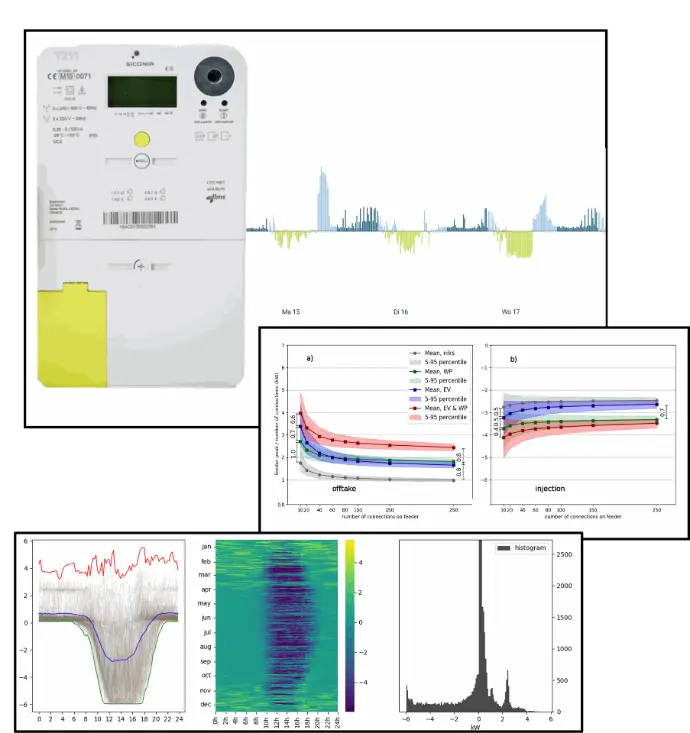
FeederForge leverages smart meter power timeseries data:
- Detection of solar panels, electric charging, heat pumps, airco, home batteries.
- Powerful visualizations allowing easy and intuitive interpretation of smart meter data.
- Detailed analysis of the grid impact per user category:
- Asset synchronous peak contribution and simultaneity factor in function of number of connections.
- Synchronous and asynchronous peak timings and load patterns.
- Peak correlations with weather, tariffs, time of day and week, season.
- Grid capacity requirements per device type.
- Behavioral evolution in function of time and policy decisions.
Lorenzini
The Challenge
More and more DSOs are investing in measurement equipment in their MV/LV cabins, either on the feeder heads, the distribution boards, or the transformers. This measurement equipment generates massive amounts of data, and many DSOs struggle to go from data to concise information that is directly useful to their grid planners. Grid planners base decisions on the manually registered volumes of solar panels, electric cars, or electric heating and cooling. However, this data is frequently lagging to the reality and prone to errors, resulting in grid planners assessing connection requests using faulty data.
Lorenzini is our solution.
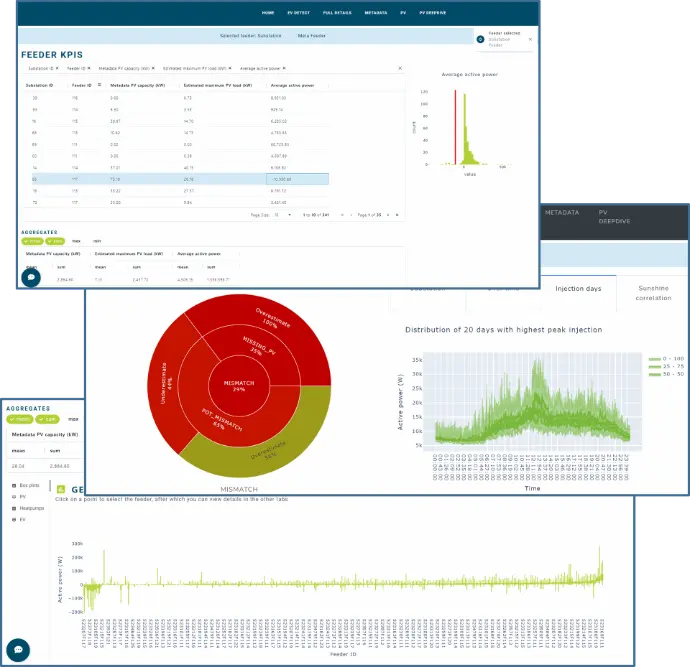
Lorenzini leverages feeder and cabin measurements:
- Quantification of the solar production and electric heating/cooling volumes connected to the asset; comparison of detected volumes to registered volumes; quantification of the historic growth pace of solar, heating and cooling.
- Powerful visualizations allowing easy and intuitive data interpretation.
- Asset indicators, yielding intuitive insight on the load patterns and remaining hosting capacity.
- Top-down view: intuitive data analysis tool with overview statistics on the installed asset base, that allows grid planners to easily categorize and identify assets according to the load.
- Detailed asset view: intuitive view on the asset load and capacity statistics, tailored to the needs of grid planners.
Piri
The Challenge
The GIS and electric data describing the layout and topology of the low voltage grid is among the most company critical data of a DSO. It is used daily by operators in the field to handle incidents, it is used to notify customers of planned outages, it is used to forecast congestions and to plan investments. But this topology data is often incomplete and prone to errors. Few DSOs know the phase connectivity. Also which house connects to what cable, or how the open points between cables are configured, is often unknown or faulty. And as garbage in is garbage out, this implies that all above important tasks are regularly based on wrong information.
Piri is our solution.
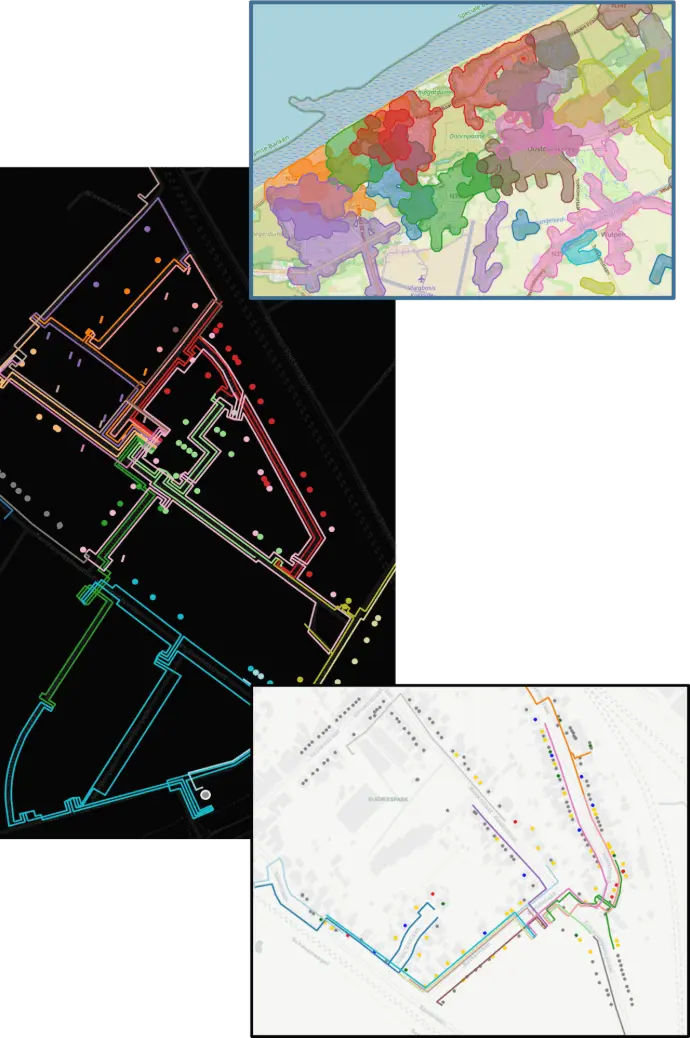
Piri maps the grid topology using smart meter voltage data and GIS cable data:
- Determines configuration of open points, connection2cable connectivity and phase connectivity.
- Resilient to complex field conditions: missing or limited smart meter data, inaccurate GIS data, multiple cables under the pavement, both 3N400V and 230V grids, mono and three phase connections.
- Low computational requirements.
- Detects large grid unbalances and yields rebalancing advice.
Pythia
The Challenge
Historically, our low-voltage grids were steady state or only slowly evolving, and fit & forget was an effective method to manage them. This is rapidly changing. On the one hand due the steep growth of solar production, electric charging, heating and cooling. But also due to the increase in controlled and hence more synchronized behavior, as caused by dynamic or ToU tariffs, or due to the use of LV flexibility for balancing purposes. Not only do DSOs struggle to keep up with reinforcements. Maintaining fit & forget with a higher synchronicity due to such active control, would require a lot of precious metal in the ground. The alternative is to publish information and forecasts on the grid capacity, and/or the use by the DSO of (technical) flexibility to safeguard the grids and buy time for reinforcements.
Pythia is our solution.
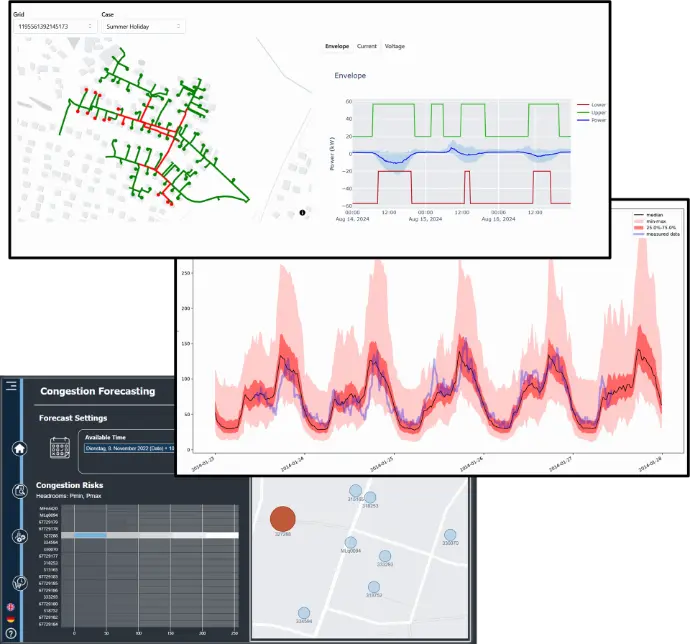
Pythia uses anonymized smart meter data and grid topology data to:
- Forecast LV grid congestions:
- Calculates the congestion probability day ahead, per quarter hour, for each bus in the LV grid.
- Builds on our unbalanced statistical power flow, and our machine learning methods to statistically forecast connection loads.
- We do not require local feeder, transfo, nor smart meter measurements. A representative set of anonymized smart meter measurements, taken from anywhere in the grid, suffices.
- Field validated accuracy. Significant deltas between our forecasts and field measurements are used by our DSO customers as an indicator of grid data quality issues.
- Calculate power envelopes or other flex control signals:
- Optimizer to calculate which connections need be constrained and by how much, to reduce congestion risk to acceptable levels.
- Code structured such that it can be adapted to your local regulation with low effort.
Kompas
The Challenge
Our grids were never designed for the energy transition’s massive growth of solar production, EV charging, heating and cooling. Large scale grid reinforcement investments are necessary. This presents DSOs with a dual challenge. Stakeholders such as regulators, policy makers and investors should be convinced of the urgent need. Indeed, Europe even demands its grid operators to periodically draw detailed long term investment plans. Also operationally this is a huge challenge: which grids are strong enough, what grids will require reinforcements, what type of congestions will pop up, where to invest first, how much to invest?
Kompas is our solution.
Kompas uses anonymized smart meter data and grid topology data to quantify the impact of long-term scenarios:
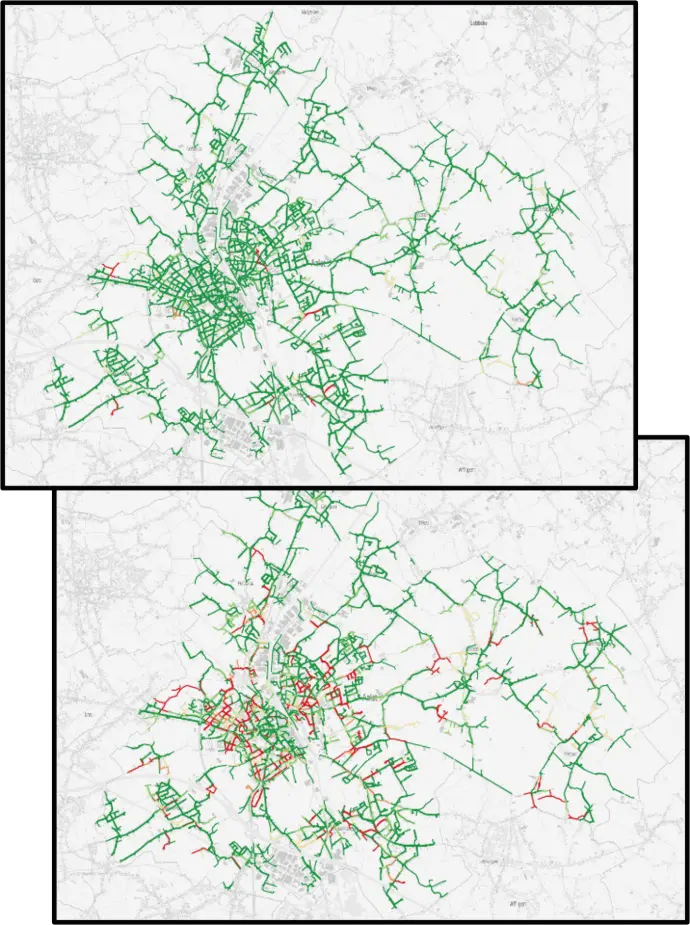
- Calculates congestion probability per feeder and transfo: overvoltage, undervoltage, overcurrent, transfo overloading.
- Powerful visualizations to yield intuitive insight into both aggregate results for larger areas and results for individual assets.
- Compares the actual situation to future scenarios, with a large array of scenario configuration options. Our code is organized so we can integrate your specific future growth parameters with low effort.
- Advanced machine learning methods to model current and future connection loads.
- The Kompas engine builds on our unbalanced statistical power flow, which has a high performance implementation. For examples: a 24h scenario for 200k feeders takes 3,7B power flow calculations. This takes 8h calculation time on a 96 core server.
- The accuracy is field validated. Significant deltas between our simulation result and field measurements are used by our DSO customers as an indicator of grid data quality issues.
- We do not require local feeder, transfo, nor smart meter measurements. A representative set of anonymized smart meter measurements, taken from anywhere in the grid, suffices.