

know
your grid
Invest where it counts
Data is only usable when it is complete, correct, and interpretable — conditions that are rarely met in low-voltage grid data. What sets Orion apart is that we do not push this responsibility onto the DSO. Instead, our tools correct and enrich your data, transforming raw input into reliable information that supports every application built on it.
IN OPERATION
IN OPERATION
THE CHALLENGE
The GIS and electrical data that describe the layout and topology of the low-voltage grid are among the most company-critical data a DSO holds. This information is used every day to manage incidents in the field, notify customers of planned outages, plan grid investments, and assess future congestion risks. Yet topology data is often incomplete, outdated, or inaccurate. Which customer is connected to which cable? What are the actual switch positions in cable distribution cabinets? Which phase is each customer connected to? Many DSOs do not have definitive answers to these questions. Because every grid calculation relies on this data, its quality is essential: inaccurate topology data leads to inaccurate analyses, forecasts, and decisions. Garbage in, garbage out.
OUR SOLUTION
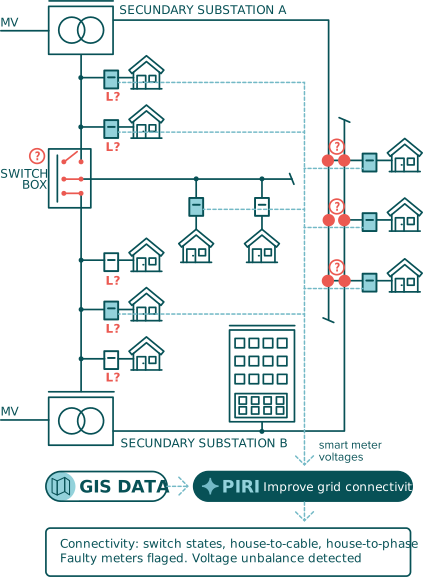
Piri maps the grid topology using smart meter voltage data and GIS data. Co-developed and field-validated with Fluvius, Piri improved connection-to-circuit connectivity from 70% to 95% correct. It is today fully operationally deployed.
What Piri does:
The GIS and electrical data that describe the layout and topology of the low-voltage grid are among the most company-critical data a DSO holds. This information is used every day to manage incidents in the field, notify customers of planned outages, plan grid investments, and assess future congestion risks. Yet topology data is often incomplete, outdated, or inaccurate. Which customer is connected to which cable? What are the actual switch positions in cable distribution cabinets? Which phase is each customer connected to? Many DSOs do not have definitive answers to these questions. Because every grid calculation relies on this data, its quality is essential: inaccurate topology data leads to inaccurate analyses, forecasts, and decisions. Garbage in, garbage out.
OUR SOLUTION
Piri maps the grid topology using smart meter voltage data and GIS data. Co-developed and field-validated with Fluvius, Piri improved connection-to-circuit connectivity from 70% to 95% correct. It is today fully operationally deployed.
What Piri does:
- Determines the switchbox configuration, connection-to-cable connectivity, and phase connectivity.
- Stays resilient in complex field conditions: missing or limited smart meter data, inaccurate GIS data, multiple cables under the pavement, both 3N400V and 230V grids, mono- and three-phase connections, underground and overhead lines.
- Low compute requirements.
- Flags GIS data-quality issues.
- Flags faulty or incorrectly installed smart meters.
- Detects large phase-voltage unbalances.
IN OPERATION
THE CHALLENGE
More and more DSOs are investing in measurement equipment in their secondary substations, either on feeder heads, distribution boards, or transformers. This equipment generates massive amounts of data, and many DSOs struggle to turn it into concise information their grid planners can use. At the same time, planners still base decisions on manually registered volumes of solar panels, electric cars, and electric heating and cooling. That data often lags reality and is prone to errors, so connection requests get assessed on faulty numbers.
OUR SOLUTION
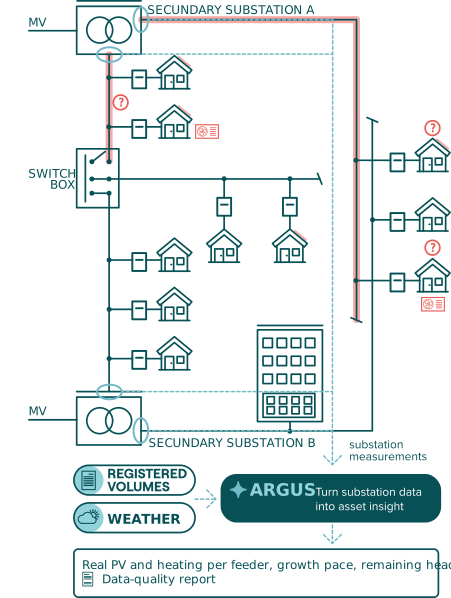
Argus leverages substation measurements. Co-developed and field-validated with Mitnetz Strom, it identifies, in every deployment so far, 30–40% of feeders where the real amount of installed PV deviates significantly from what was registered. Argus is today fully operationally deployed.
What Argus does:
More and more DSOs are investing in measurement equipment in their secondary substations, either on feeder heads, distribution boards, or transformers. This equipment generates massive amounts of data, and many DSOs struggle to turn it into concise information their grid planners can use. At the same time, planners still base decisions on manually registered volumes of solar panels, electric cars, and electric heating and cooling. That data often lags reality and is prone to errors, so connection requests get assessed on faulty numbers.
OUR SOLUTION
Argus leverages substation measurements. Co-developed and field-validated with Mitnetz Strom, it identifies, in every deployment so far, 30–40% of feeders where the real amount of installed PV deviates significantly from what was registered. Argus is today fully operationally deployed.
What Argus does:
- Quantifies the solar-production and electric heating volumes connected to an asset, compares detected volumes to registered volumes, and quantifies each asset’s historic growth pace of solar production and electric heating.
- Offers visualizations that allow easy and intuitive data interpretation.
- Provides asset indicators giving intuitive insight into load patterns and remaining hosting capacity.
- Top-down view: an intuitive interface with overview statistics on the installed asset base, letting planners categorize the assets.
- Detailed asset view: an intuitive view of a selected asset’s load and capacity statistics, tailored to grid planners’ needs.
IN OPERATION
IN OPERATION
IN OPERATION
THE CHALLENGE
Driven by the energy transition, DSOs face rapid growth of solar panels, EV chargers, heat pumps, and home batteries. Grid engineers need to know where these are and how they behave to keep an accurate view of available grid capacity, plan reinforcements, and compose investment plans. But manual registration is costly and error-prone, data on how these devices behave and affect the synchronous peak is rare, and the assumptions about it are unvalidated.
OUR SOLUTION
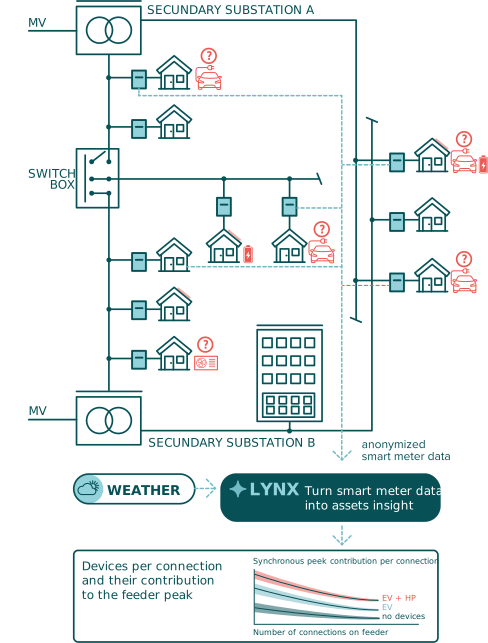
Lynx leverages smart meter power time-series data. Co-developed with Fluvius using anonymised 15-minute smart meter measurements of more than 200 000 Flemish connections, Lynx quantified the average impact of EV charging and heat pumps given Flemish climate, policy, and behaviour. EV charging adds 1,9 kW per connection to the feeder synchronous peak, heat pumps add 1,4 kW per connection. Combined in a single household, they add on average 2,4 kW per connection. Lynx is today in full operational use.
What Lynx does:
Driven by the energy transition, DSOs face rapid growth of solar panels, EV chargers, heat pumps, and home batteries. Grid engineers need to know where these are and how they behave to keep an accurate view of available grid capacity, plan reinforcements, and compose investment plans. But manual registration is costly and error-prone, data on how these devices behave and affect the synchronous peak is rare, and the assumptions about it are unvalidated.
OUR SOLUTION
Lynx leverages smart meter power time-series data. Co-developed with Fluvius using anonymised 15-minute smart meter measurements of more than 200 000 Flemish connections, Lynx quantified the average impact of EV charging and heat pumps given Flemish climate, policy, and behaviour. EV charging adds 1,9 kW per connection to the feeder synchronous peak, heat pumps add 1,4 kW per connection. Combined in a single household, they add on average 2,4 kW per connection. Lynx is today in full operational use.
What Lynx does:
- Detects solar panels, electric charging, heat pumps, air conditioning, and home batteries.
- Offers visualizations that allow easy and intuitive interpretation of smart meter data.
- Provides detailed analysis of grid impact per user category:
- Asset synchronous-peak contribution and simultaneity factor as a function of the number of connections.
- Synchronous and asynchronous peak timings and load patterns.
- Peak correlations with weather, tariffs, time of day and week, and season.
- Grid-capacity requirements per device type.
- Behavioural evolution as a function of time and policy decisions.