

plan
your grid
Invest where it counts
The workload and scope of low-voltage grid planners are rising rapidly. Our tools help them work faster and make better-informed decisions, enabling safe operation of grids closer to their available capacity.
IN PILOT
IN PILOT
THE CHALLENGE
Electrification and distributed generation are making connection capacity requests rise rapidly. At the same time, DSOs are launching structural reinforcement programs to prepare the low-voltage grid for the energy transition — the first at large-scale in decades. A key bottleneck is skilled staff, who lose time on clumsy calculation tools, often still Excel- or paper-based, to assess new connections and design reinforcements. The grid calculations behind these studies rely on rules of thumb, or at best a slow, simplified power-flow calculation. The resulting inaccuracies must be offset with larger safety margins, which lowers grid utilisation.
OUR SOLUTION
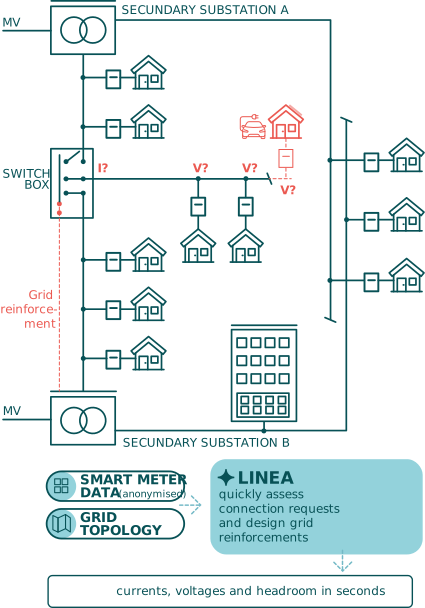
Linea is our browser-embedded grid design, planning, and study tool, using anonymised smart meter data and grid topology data. It is currently in pilot.
What Linea does:
Electrification and distributed generation are making connection capacity requests rise rapidly. At the same time, DSOs are launching structural reinforcement programs to prepare the low-voltage grid for the energy transition — the first at large-scale in decades. A key bottleneck is skilled staff, who lose time on clumsy calculation tools, often still Excel- or paper-based, to assess new connections and design reinforcements. The grid calculations behind these studies rely on rules of thumb, or at best a slow, simplified power-flow calculation. The resulting inaccuracies must be offset with larger safety margins, which lowers grid utilisation.
OUR SOLUTION
Linea is our browser-embedded grid design, planning, and study tool, using anonymised smart meter data and grid topology data. It is currently in pilot.
What Linea does:
- User-friendly visualization and editing of the low-voltage grid:
- Configurable grid visualizations, letting a planner assess the grid situation quickly and effortlessly.
- Draw new grid elements: connections, cables, substations, switchboxes.
- Easily adjust the parameters and configuration of substations, cables, and switchboxes.
- Easily adjust individual or grouped connections: the planner changes connection features such as kWp PV or annual consumption, and the model adapts the underlying load model automatically.
- Project management tailored to DSO grid-design workflows.
- DSO-defined templates for houses with EV, PV, and so on.
- Calculates grid loading and voltages quickly and accurately, building on our high-performance unbalanced Monte Carlo statistical power flow (see The Orion statistical power-flow engine).
- Delivers instant, interpretable results: although the underlying calculations are complex and numerous, great care has gone into summarising them, visually and numerically, so a planner gets instant insight into the cost, congestion risk, and asset headroom of a given situation.
IN PILOT
THE CHALLENGE
Our grids were never designed for the energy transition’s massive growth of solar production, EV charging, and electric heating and cooling. Large-scale reinforcement investments are necessary, and this presents DSOs with a dual challenge. On one side, stakeholders such as regulators, policymakers, and investors must be convinced of the urgent need ― Europe even obliges grid operators to draw up detailed long-term investment plans periodically. On the other, the operational question is hard: which grids are strong enough, which will need reinforcement, what congestion will appear, where to invest first, and how much to invest?
OUR SOLUTION
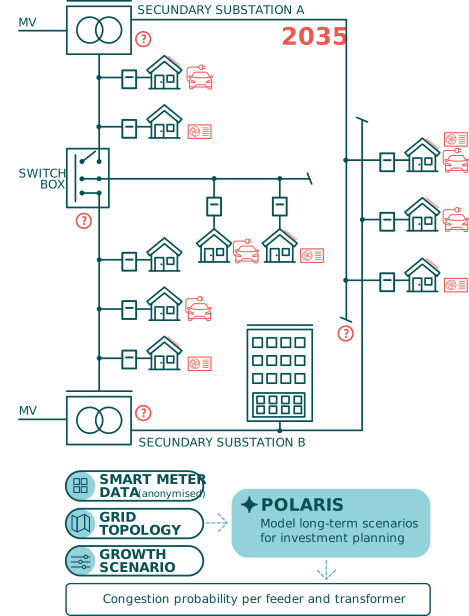
Polaris uses anonymised smart meter data and grid topology data to quantify the impact of long-term scenarios. Running a 24-hour worst-case scenario for 200 000 feeders involves 3,7 billion unbalanced power-flow calculations; on a 96-core server this takes only 8 hours. Polaris is currently in pilot.
What Polaris does:
Our grids were never designed for the energy transition’s massive growth of solar production, EV charging, and electric heating and cooling. Large-scale reinforcement investments are necessary, and this presents DSOs with a dual challenge. On one side, stakeholders such as regulators, policymakers, and investors must be convinced of the urgent need ― Europe even obliges grid operators to draw up detailed long-term investment plans periodically. On the other, the operational question is hard: which grids are strong enough, which will need reinforcement, what congestion will appear, where to invest first, and how much to invest?
OUR SOLUTION
Polaris uses anonymised smart meter data and grid topology data to quantify the impact of long-term scenarios. Running a 24-hour worst-case scenario for 200 000 feeders involves 3,7 billion unbalanced power-flow calculations; on a 96-core server this takes only 8 hours. Polaris is currently in pilot.
What Polaris does:
- Calculates congestion probability per feeder and transformer: overvoltage, undervoltage, overcurrent, transformer overloading.
- Offers visualizations that yield intuitive insight into both aggregate results for larger areas and results for individual assets.
- Compares the current situation to future scenarios, with a wide array of scenario configuration options. Our code is organized so we can integrate your specific future-growth parameters with little effort.
- Builds on our high-performance unbalanced Monte Carlo statistical power flow (see The Orion statistical power-flow engine).
IN PILOT
IN PILOT
IN PILOT
THE CHALLENGE
EU Directive 2024/1711 requires DSOs to publish detailed grid-capacity maps down to the LV level. However, the specific requirements, and the definition of hosting capacity, vary across the member-state adaptations.
OUR SOLUTION
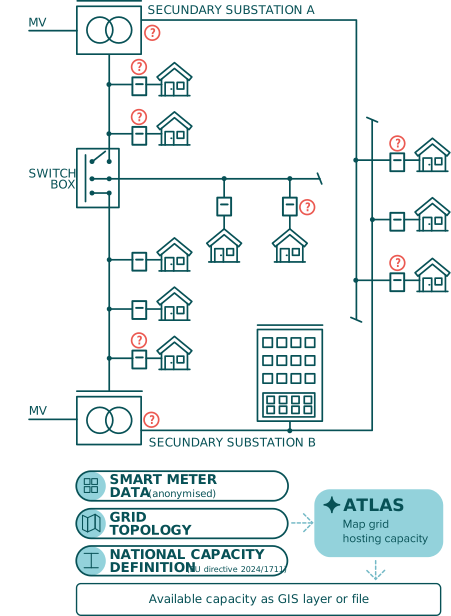
Atlas uses anonymised smart meter data and grid topology data to generate low-voltage grid-capacity maps, at substation and feeder level. It is currently in development.
What Atlas does:
EU Directive 2024/1711 requires DSOs to publish detailed grid-capacity maps down to the LV level. However, the specific requirements, and the definition of hosting capacity, vary across the member-state adaptations.
OUR SOLUTION
Atlas uses anonymised smart meter data and grid topology data to generate low-voltage grid-capacity maps, at substation and feeder level. It is currently in development.
What Atlas does:
- A configurable software library wrapping our power-flow engine (see The Orion statistical power-flow engine)
- Supports multiple hosting-capacity definitions and allows low-effort extension for new ones.
- Supports both file export and GIS map exports, all configurable to the DSO needs and regulatory requirements.